• alpha
  • MIT license
  • Python 3.12+
  • CLI, Docker, pipx

Your AWS network, drawn from the real thing

VPC Atlas reads your AWS account, read-only, and draws the network in draw.io and Lucidchart. It also writes an inventory and serves a dashboard.

by Karina Pérez, DevOps engineer · Alpha release, free and open source under the MIT licence. Binaries for macOS, Linux and Windows, a Docker image and a Python package.

# macOS and Linux binary
curl -fsSL https://vpcatlas.com/install.sh | sh
# Python
pipx install git+https://github.com/vpcatlas/vpcatlas
# Docker
docker run --rm -v ~/.aws:/root/.aws:ro -v "$PWD/out:/out" vpcatlas/vpcatlas discover --profile audit --output-dir /out
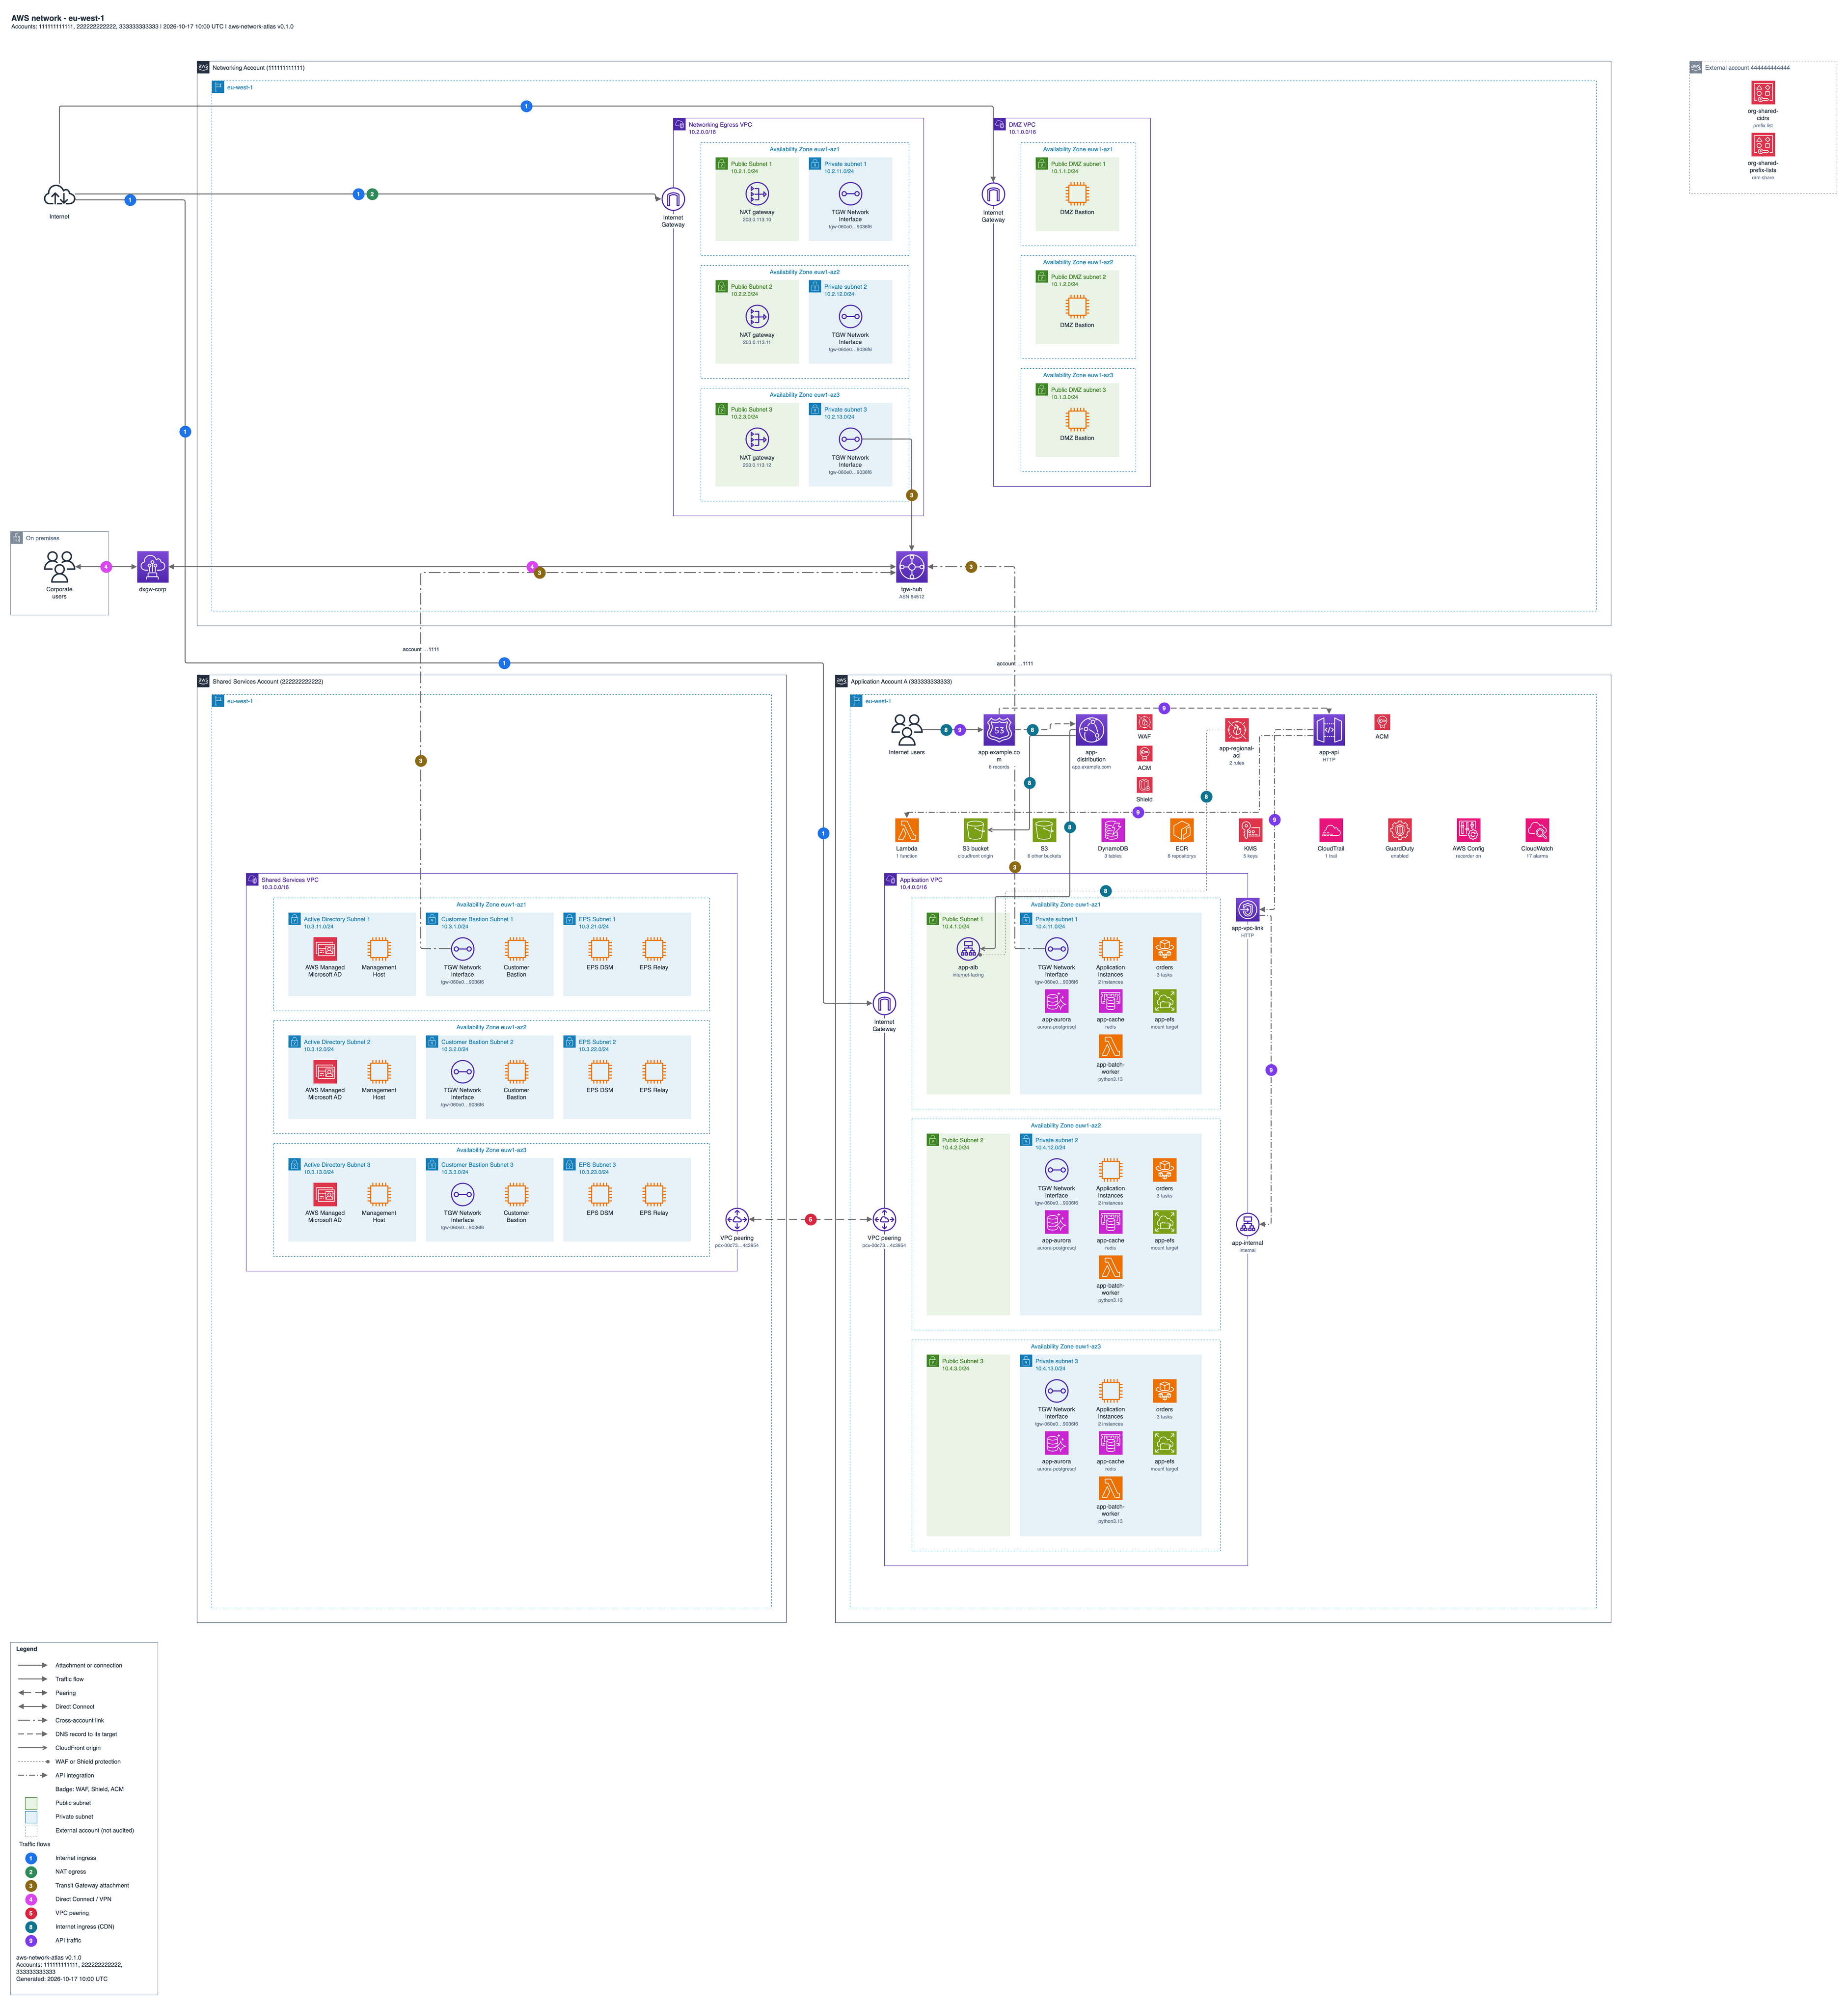
Region page of an example landing zone: three accounts with VPCs, subnets and workloads, edge services, service rows, numbered traffic flows and a legend.
vpcatlas / vpcatlas PythonMITsource public at launch

What you get

A region page: users and edge services (Route 53, CloudFront, WAF, API Gateway) at the top, service rows, and VPCs with subnets and workloads.

Diagrams you can edit

A Global page, one page per region and one page per VPC, in draw.io and Lucidchart, with the AWS Architecture Icons and the landing zone layout. Traffic flows are numbered and come with a legend, and the same input always gives the same drawing.
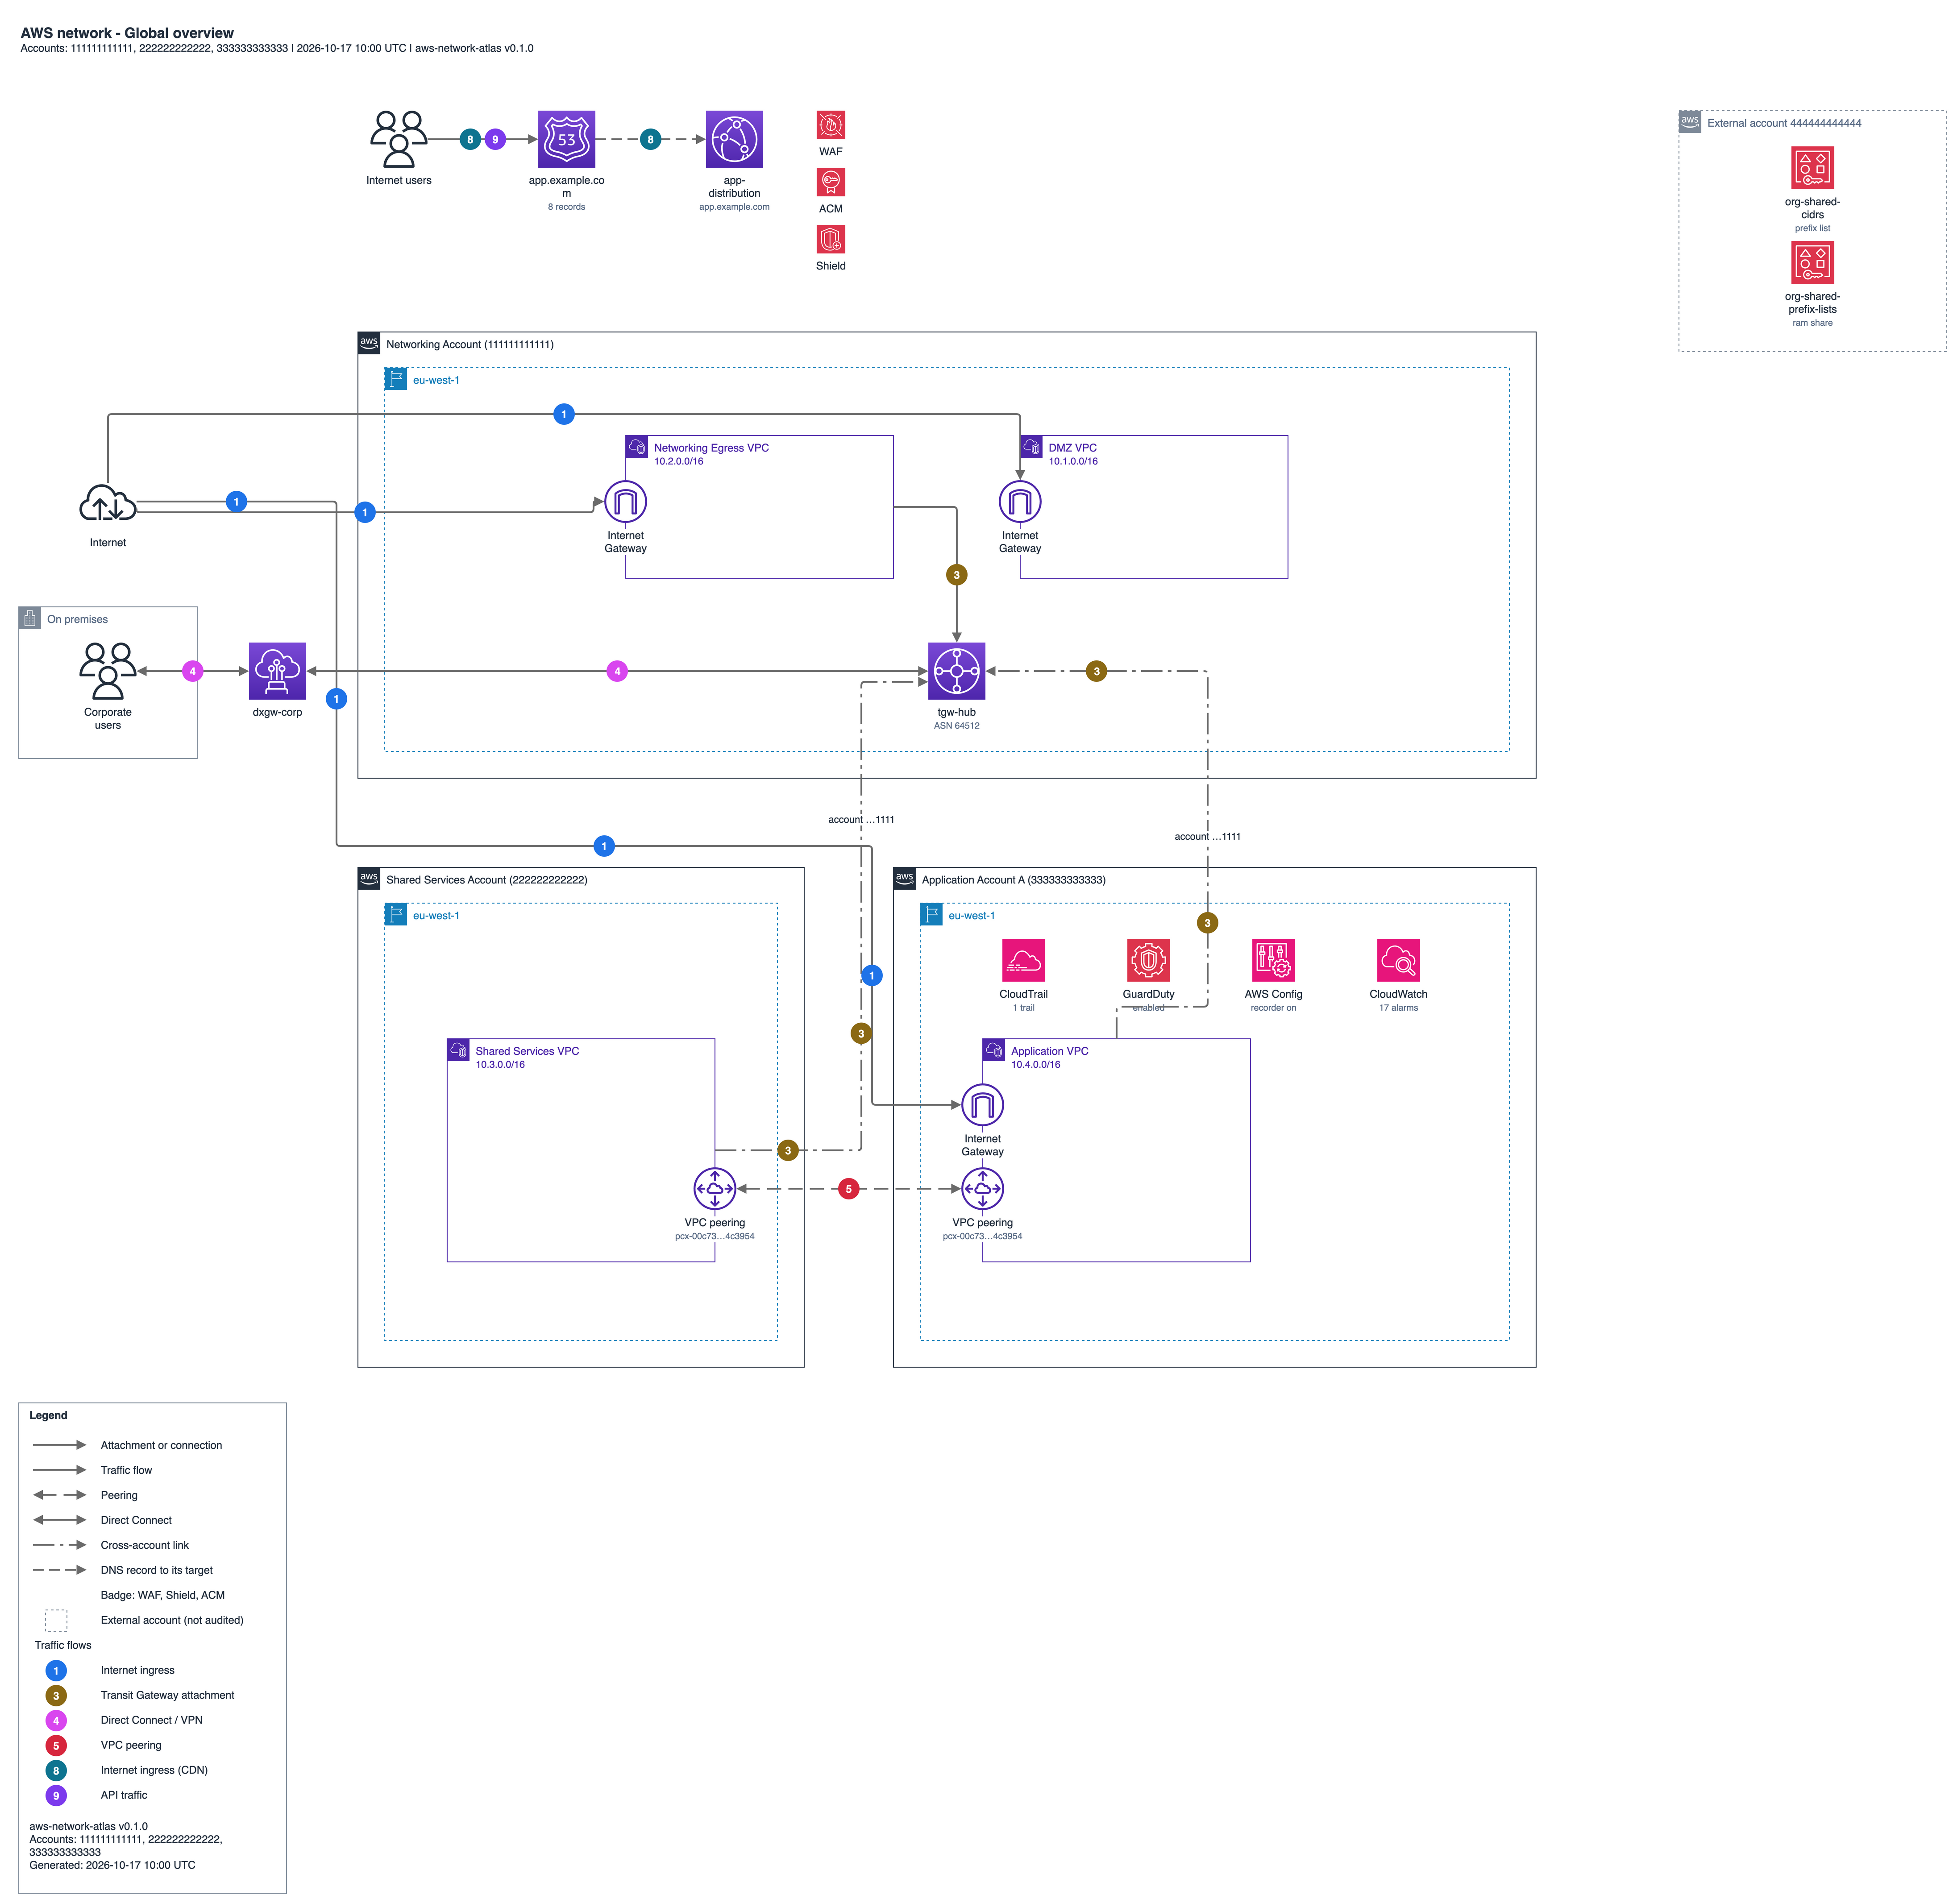
The Global page: three accounts, the Transit Gateway hub, a VPC peering, a Direct Connect gateway and an external account.

An inventory you can read and diff

Every network resource and service the tool reads, in JSON, Markdown and HTML. Each external account linked to yours gets its own section.

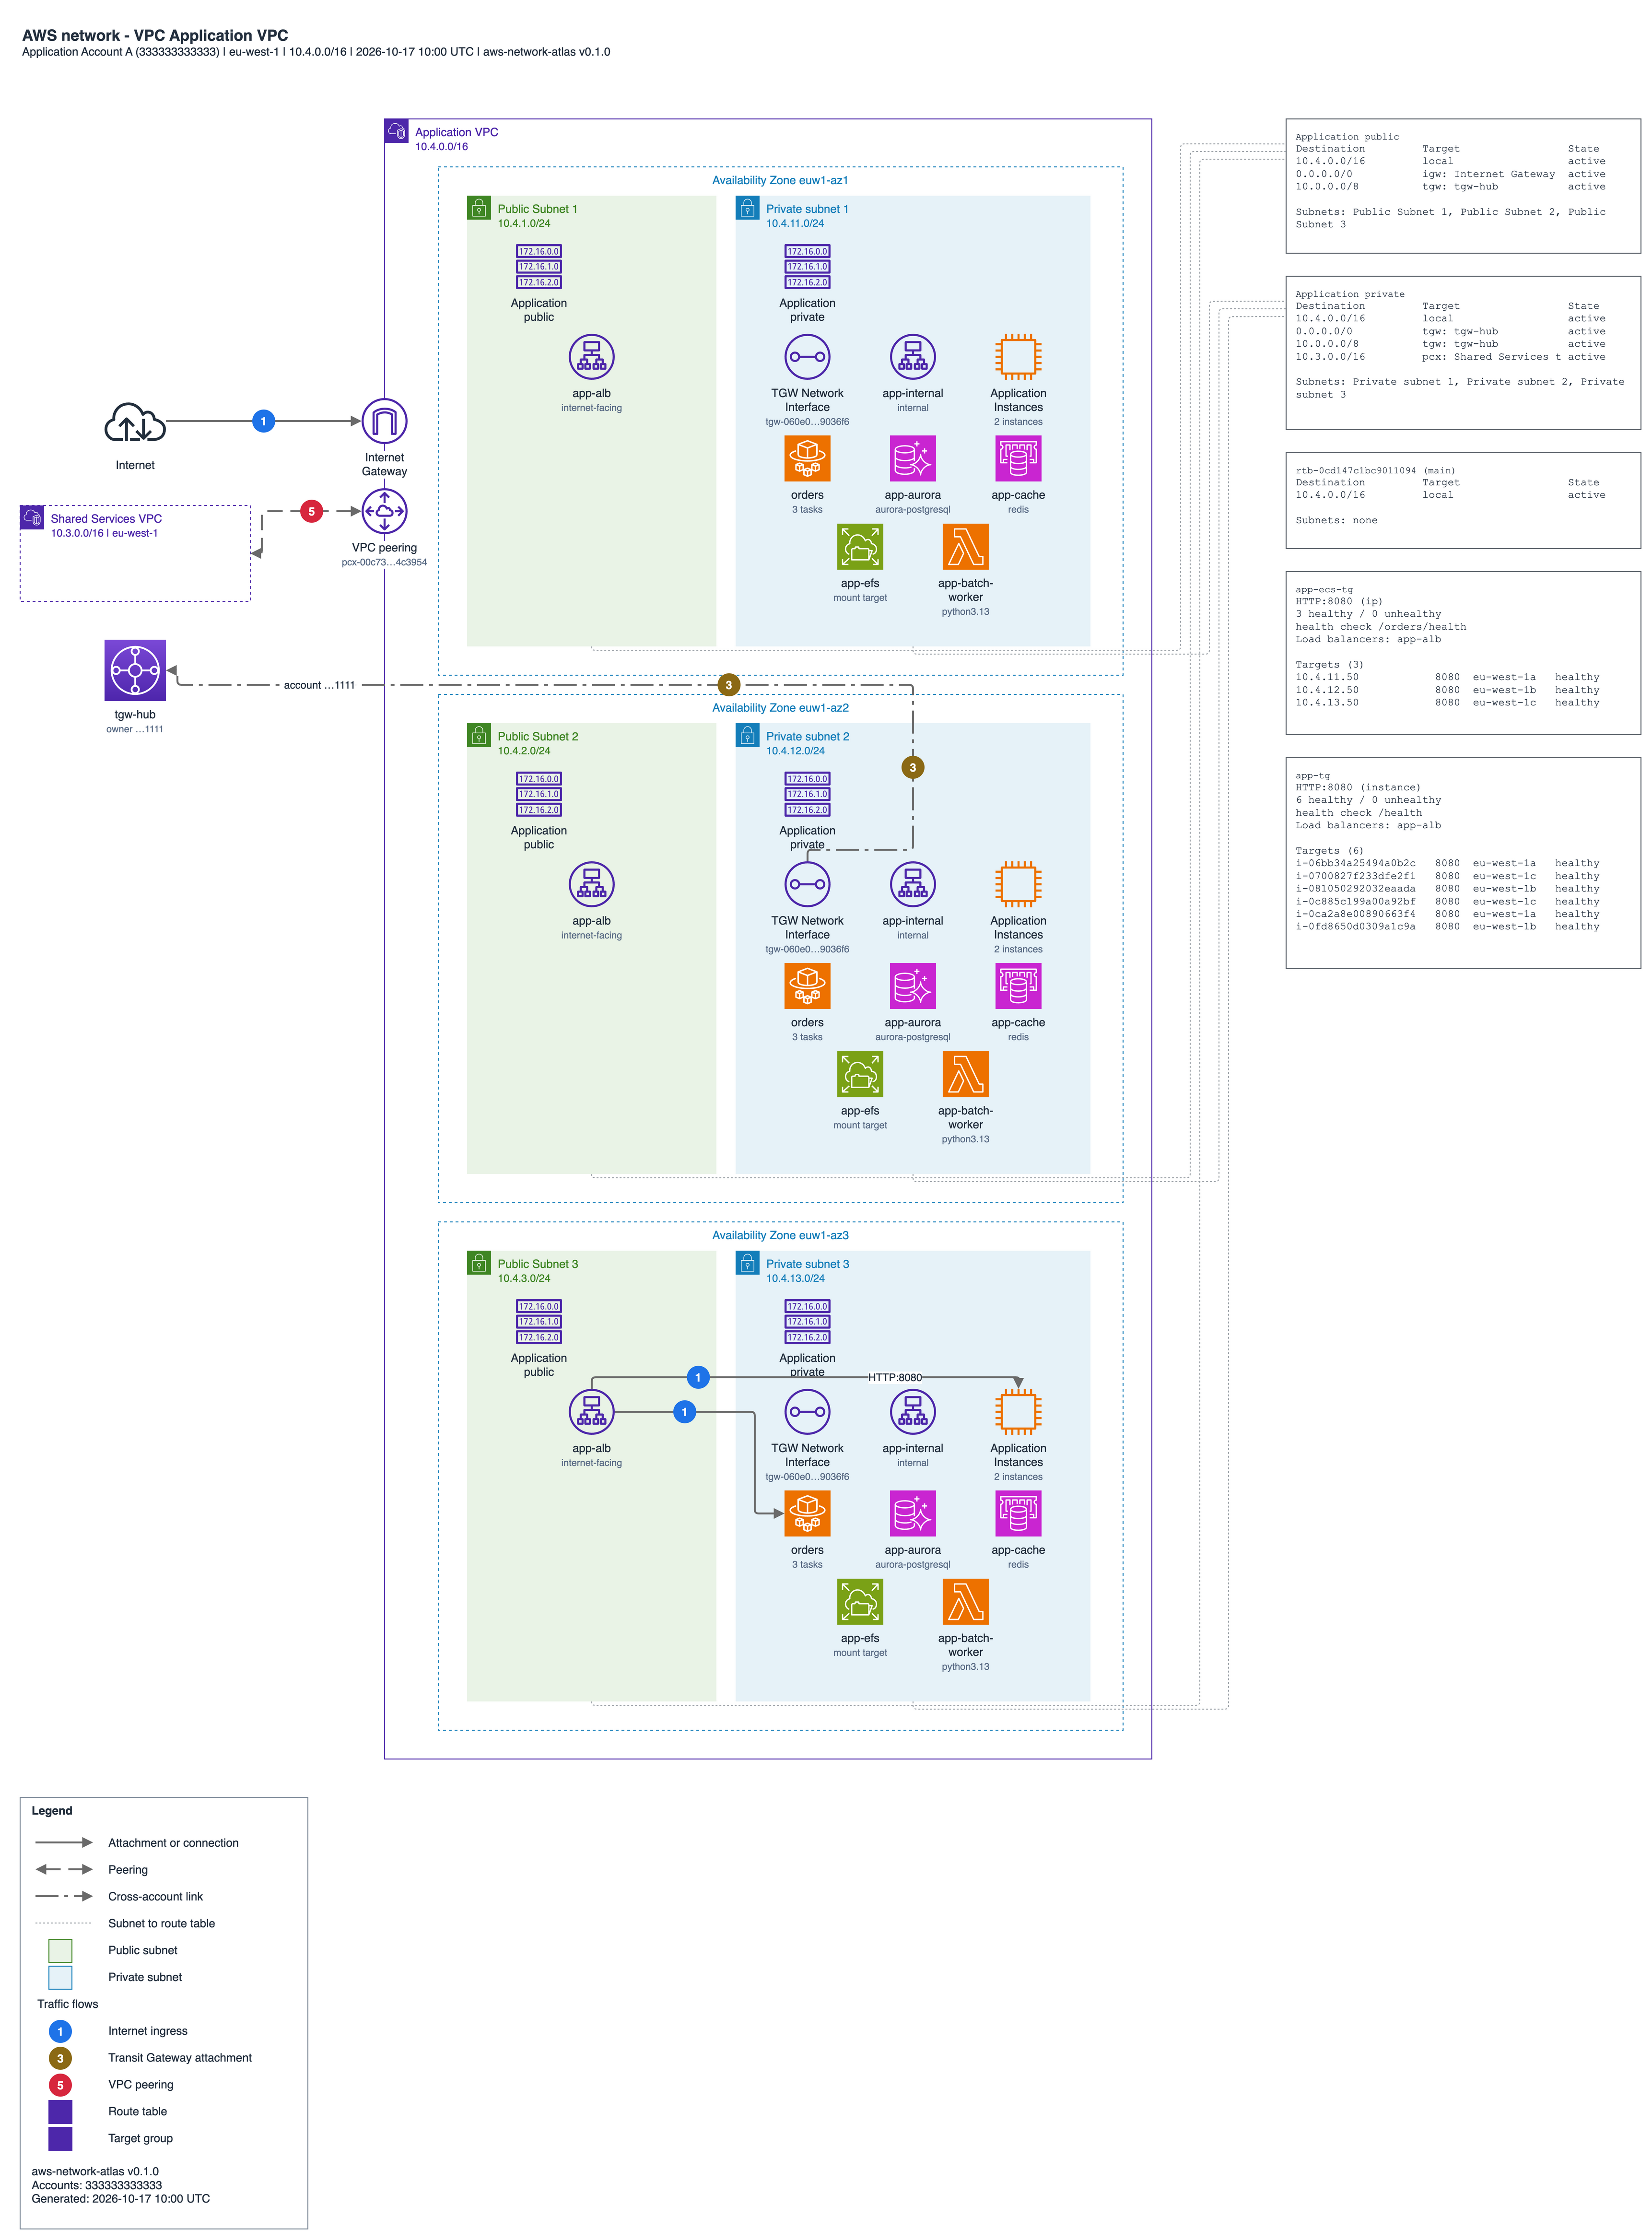
A VPC page: the VPC with its subnets and workloads, and route table and target group cards beside it.

A dashboard that shows what changed

The dashboard refreshes at the interval you set and serves the same diagrams. Pick two runs and it frames what was added in green and what changed in orange.

How it works

  1. Print the auditor policy and attach it to a role

    Install the tool, print the minimal read-only policy and attach it to a role in the account you want to map. You can use the AWS managed policy ReadOnlyAccess instead.

    pipx install git+https://github.com/vpcatlas/vpcatlas
    vpcatlas --help
    
    # Print the minimal auditor policy
    vpcatlas iam-policy > auditor-policy.json
  2. Run vpcatlas discover against your account

    Use a profile, or assume the role you just created. The tool writes the diagrams, the inventory and the graph to the output folder. One run reads one account.

    # Discover the account and write every output format
    vpcatlas discover --profile audit --regions eu-west-1,us-east-1 --output-dir ./out --format all
    
    # Assume a role in the target account instead of using a profile
    vpcatlas discover --role-arn arn:aws:iam::111122223333:role/VpcAtlasAuditor --regions eu-west-1 \
      --output-dir ./out --format drawio
  3. Open the diagrams, or serve the dashboard

    Open the .drawio files in draw.io, or import the .lucid files into Lucidchart. Or serve the dashboard and let it refresh every 15 minutes.

    # Diagrams from a previous discovery
    vpcatlas diagram --cache ./out/vpcatlas-graph.json --format lucid
    
    # Dashboard, with a periodic refresh every 15 minutes
    VPCATLAS_REFRESH_SECONDS=900 vpcatlas serve --port 8080

Examples

These drawings come from a synthetic landing zone with three accounts and example data, not from a customer. One run reads one account, so they show the style and the format the tool writes.

Region page of the example landing zone: edge services, service rows and VPCs.
Region pageFull size
Global page of the example landing zone: accounts, Transit Gateway hub, peering and an external account.
Global pageFull size
VPC page of the example landing zone: subnets and workloads, with route table and target group cards.
VPC pageFull size

Manifesto

Five rules the tool is built on.

  1. Read-only by design

    It only calls read APIs and prints the auditor policy it needs, so you can read what it asks for before you grant it.

  2. Nobody should draw the map

    A drawn map is wrong a week later; the tool rebuilds it from the live account, on demand or on a schedule.

  3. Same input, same drawing

    Nothing moves between two runs unless the network moved, so a diff means something.

  4. Honest about gaps

    A denied call becomes a documented gap, never a silent hole in the map.

  5. It runs where you run it

    A command line tool, a binary and a container image; no agents, no telemetry; the only calls go to the AWS APIs.

What it reads

Network
  • accounts
  • regions
  • VPCs
  • subnets
  • route tables
  • internet and NAT gateways
  • Transit Gateways and attachments
  • VPC peering
  • VPN and Direct Connect
  • endpoints
  • load balancers and target groups
  • Network Firewall
  • Route 53 Resolver
  • RAM shares
Edge and DNS
  • Route 53 zones and records
  • CloudFront
  • WAF
  • ACM
  • Shield
Compute
  • ECS
  • EKS
  • EC2 instance groups
  • Lambda
  • API Gateway
Data
  • RDS and Aurora
  • ElastiCache
  • EFS
  • S3
  • DynamoDB
Account services
  • CloudTrail
  • GuardDuty
  • Config
  • CloudWatch
  • KMS
  • ECR

Who makes it

Karina Pérez is a DevOps engineer based in Spain. She runs the AWS infrastructure of a production payments platform as code with Terraform, after years of Kubernetes, CI/CD and multi-account landing zones. She started VPC Atlas because every team she joined asked for the network diagram first, and the diagram was always out of date. She holds a degree in computer science and the AWS Cloud Practitioner certification, and is studying a master's degree in applied AI.

Download