 VPC Atlas
Nobody keeps the AWS network diagram current. I built a tool for it
VPC Atlas reads an AWS account with read-only calls and draws its network in draw.io and Lucidchart. Alpha, MIT licensed.
Every team I joined asked for the same thing first: the network diagram. The one that shows every VPC, how the VPCs connect through Transit Gateways, peerings, VPNs and Direct Connect, and what sits at the edge in front of them. And every time, the diagram that existed was out of date.
The diagram nobody keeps
A network diagram drawn by hand is wrong a week later. Someone adds an attachment, someone shares a Transit Gateway through AWS RAM, a peering with another account appears, and the picture stays as it was.
The alternative is to rebuild it from the console: open each VPC, read the route tables, follow the attachments, check the endpoints, then draw it. On a real account that takes days. I wanted to point a tool at the account, get the diagram in minutes, and do it again next week to compare.
What VPC Atlas does
vpcatlas connects to one AWS account with auditor permissions and maps its network: accounts, regions, VPCs, subnets, routing, gateways, endpoints, load balancers, firewalls, the DNS resolver and shared resources. It also reads the DNS and edge layer (Route 53, CloudFront, WAF, ACM, Shield), compute, data stores and account services.
It is read-only by design. It calls Describe*, Get*, List* and Search* APIs and never creates, changes or deletes anything. It ships the minimal policy it needs, so you can read what it asks for before you grant it.
One run produces three kinds of output:
- Diagrams. A Global page, one page per Region and one page per VPC, as
.drawioand.lucidfiles, drawn with the AWS Architecture Icons and following the layout of the AWS Managed Services multi-account landing zone network reference. - An inventory. JSON, Markdown and HTML, with every resource account by account and a section for every external account linked to yours.
- A dashboard.
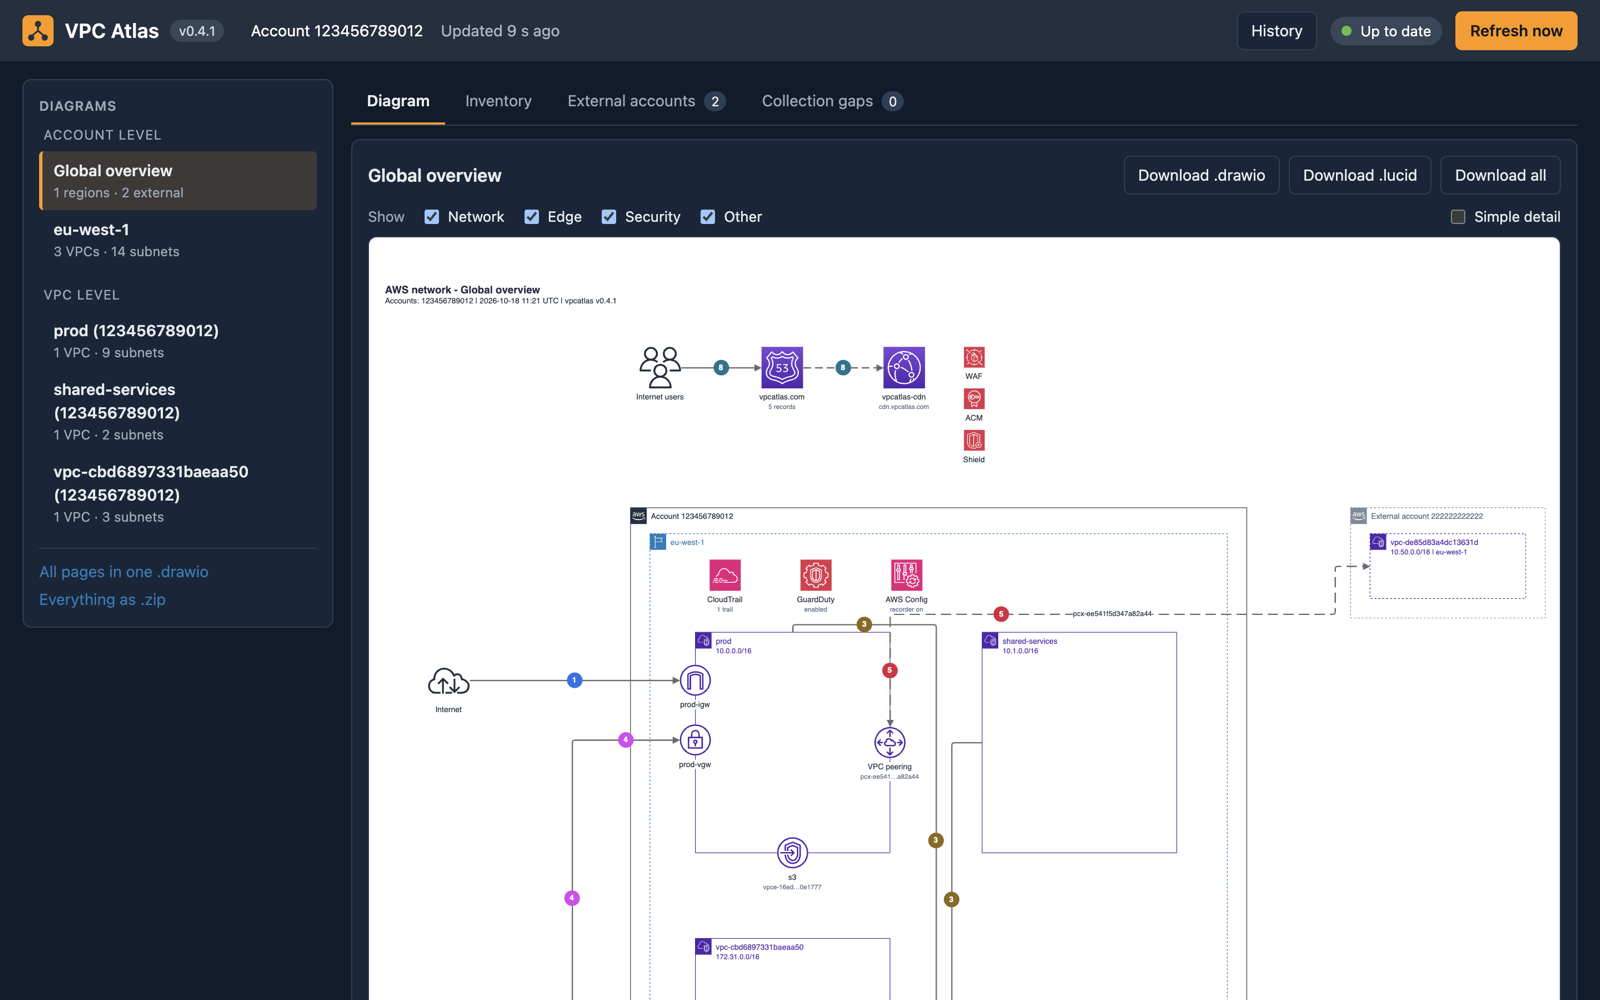
vpcatlas serveshows the same diagrams in the browser, keeps a history of scans and draws the difference between two of them: what was added in green, what changed in orange.
The raw result is also saved as vpcatlas-graph.json, so you can redraw later without calling AWS again.

The recordings and diagrams here come from a simulated AWS account, so the ids are examples. This is the dashboard on that account:
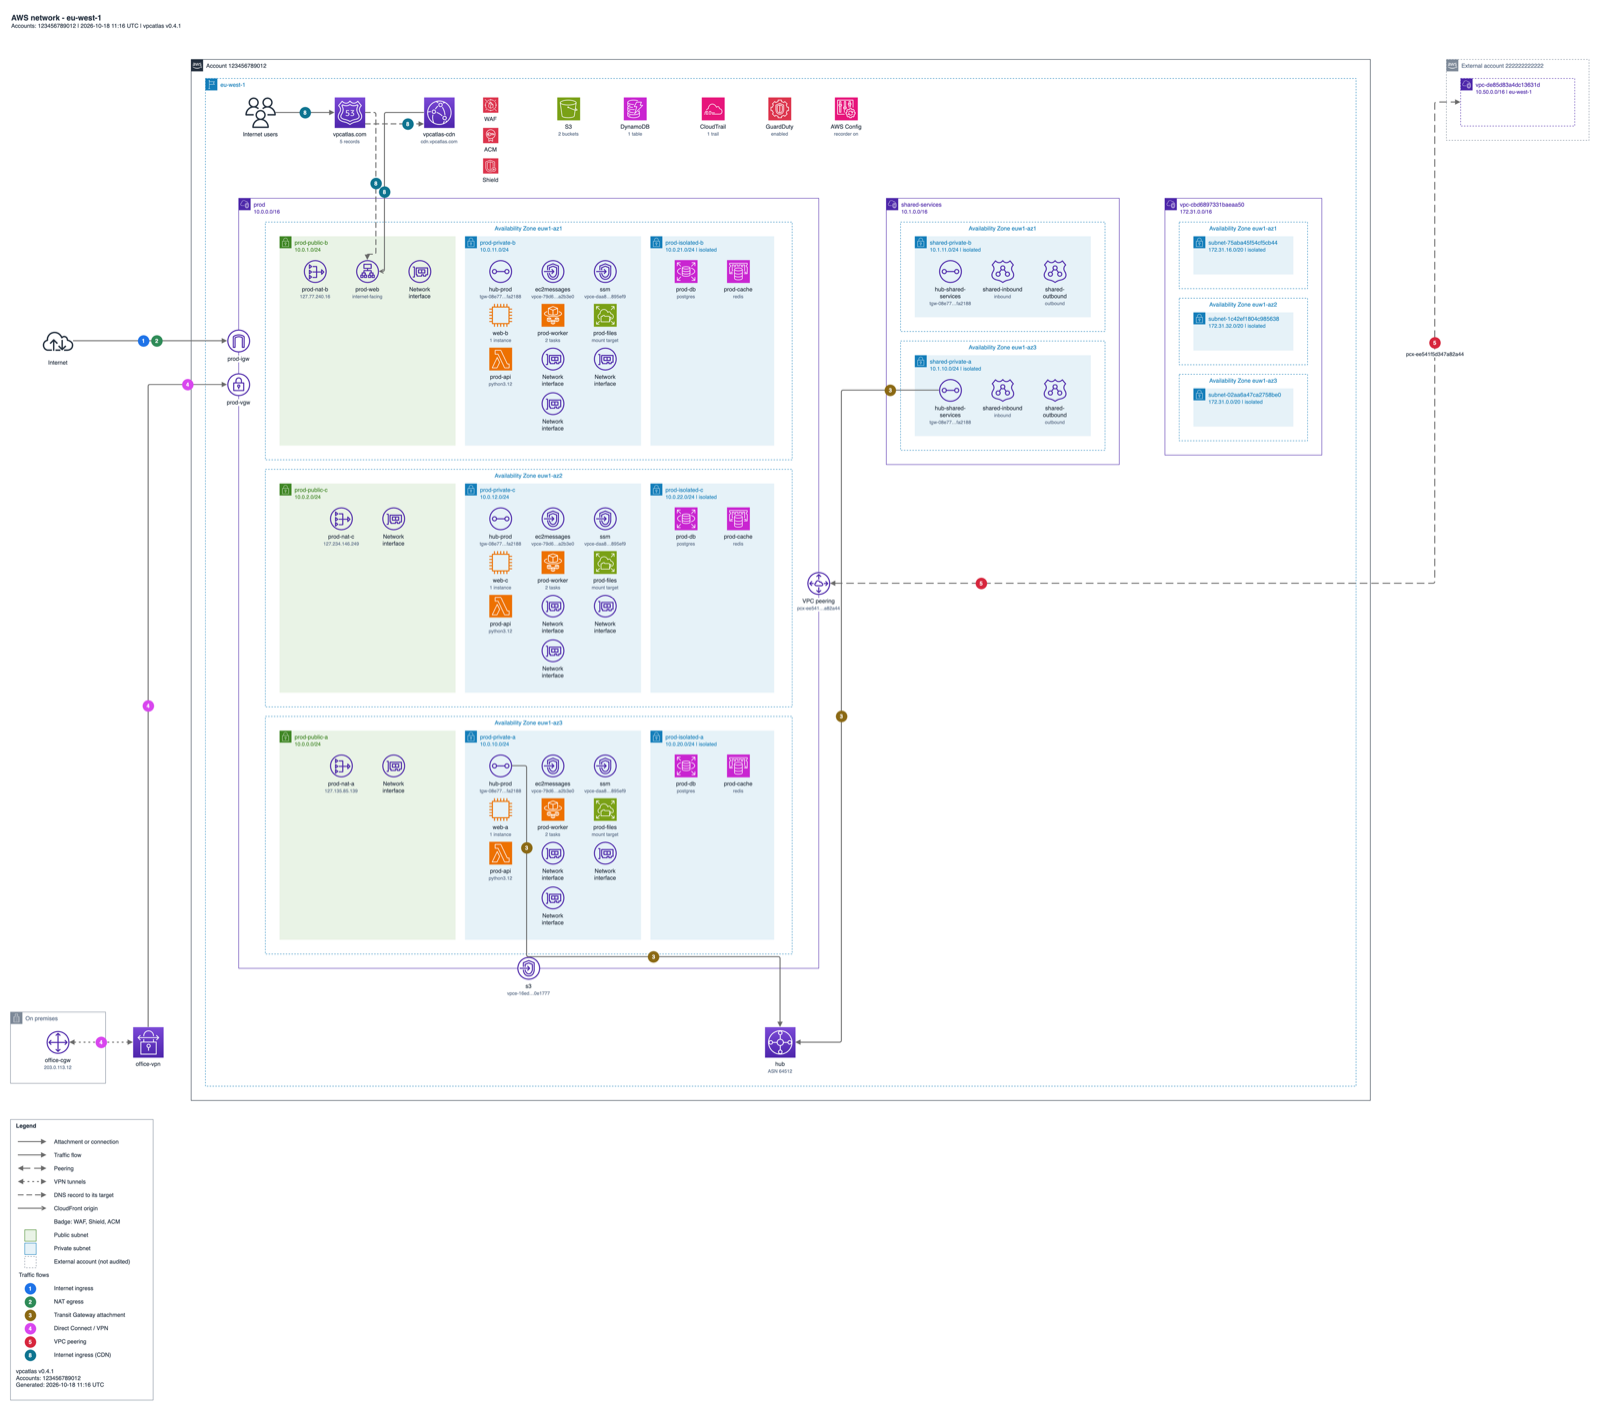
And a Region page:
How it works
A read-only pipeline with four stages: collect, graph, layout, export. Each stage has one input and one output.
Collect. One collector per service, all paginated. Regions run in parallel; inside a Region the collectors run one after another, to keep API throttling low. A call that fails with AccessDenied is logged and skipped. It never stops the run.
Graph. The results become a networkx directed graph wrapped by Pydantic models. Edges are typed (contains, routes_to, attached_to, peered_with, shared_from) and external accounts are nodes too.
Layout. Positions are computed once, as a deterministic grid: cloud, Region, VPC, availability zone, subnet. Both diagram exporters consume the same layout. The same input gives the same drawing, so nothing moves between two runs unless the network moved, and a diff means something.
Export. mxGraph XML with the mxgraph.aws4 shapes for draw.io, a Lucid Standard Import package for Lucid, and the inventory in JSON, Markdown and HTML.
The decisions that took time
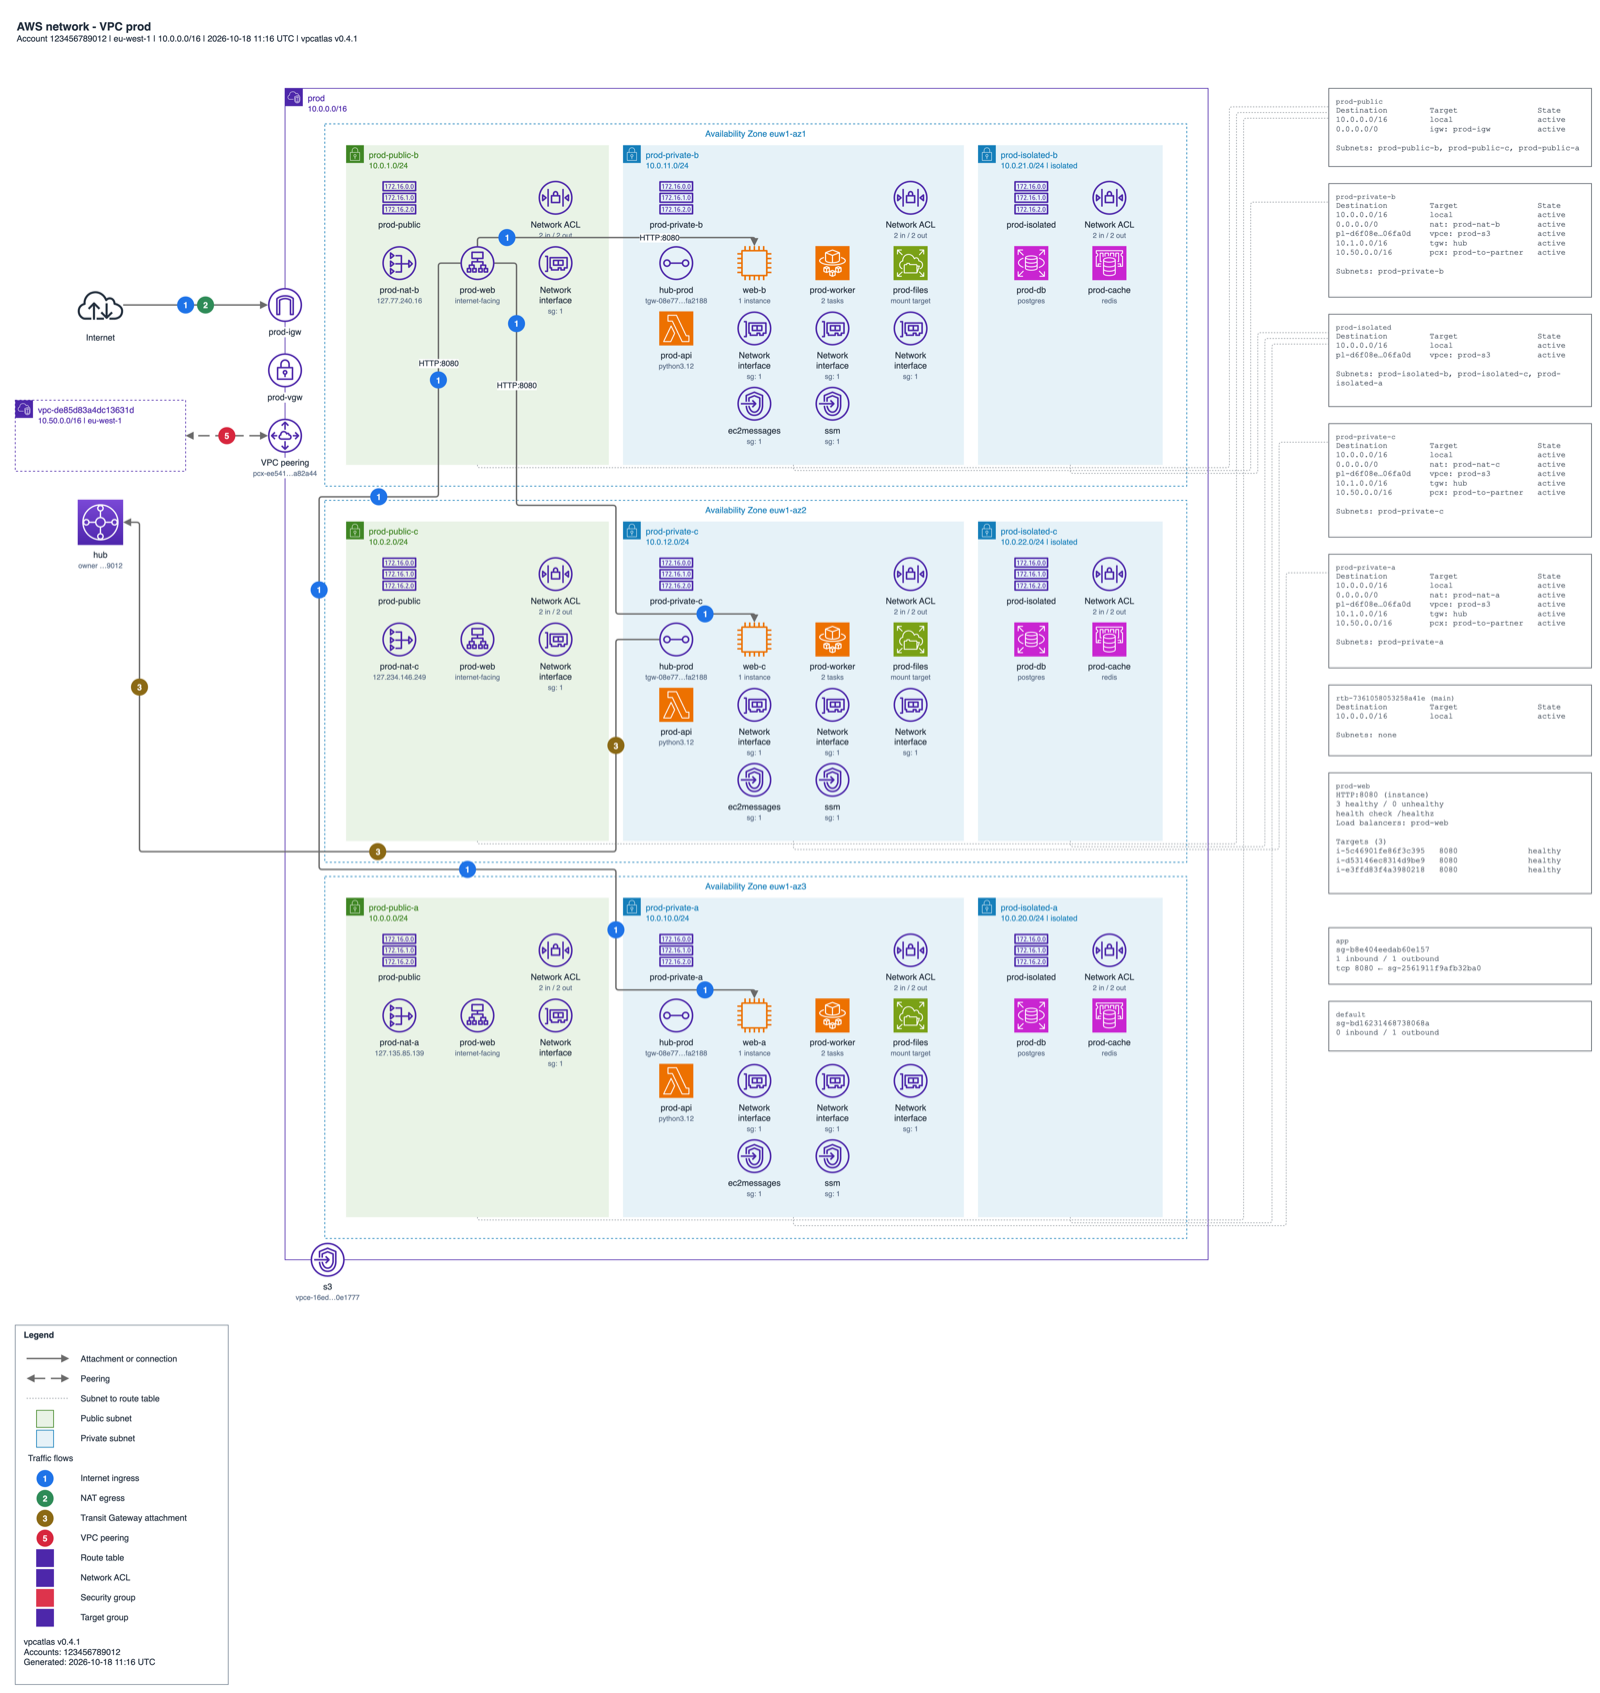
Numbered flows. Every arrow is the same grey, and numbered discs tell traffic apart. A kind of traffic keeps its number on every page: 1 Internet ingress, 2 NAT egress, 3 Transit Gateway attachment, 4 Direct Connect or VPN, 5 VPC peering, 6 shared prefix list or RAM. A legend lists the ones a page uses. The numbers come from the kind of each edge, not from observed traffic: they show how the network is built, not what it carries, and the documentation says so.
The Global page. The whole estate on one page: accounts, the Transit Gateway hub, peerings, Direct Connect gateways. Anything referenced but not owned by an audited account goes in its own dashed group per external account id.
Gaps, not holes. A denied call becomes a recorded gap. Where a count would have been, the page says not read. It never writes 0, because a zero looks like an answer.
Crowded pages. The layout is the hard part. On a page with 77 API Gateways, drawing the fans of edges as a bus (one trunk, a branch per icon) took it from 97 seconds to under a second. --detail simple folds more than three resources of one kind into one card, such as API Gateway ×77; on the same page it went from 37 seconds to under a second, and the page from 17,700 to 2,660 pixels wide.
Try it in a sandbox account
You need Python 3.12 or newer and an AWS account you may read.
pipx install vpcatlas
vpcatlas iam-policy > auditor-policy.json   # attach this to the role or user you will use
vpcatlas discover --profile audit --output-dir ./out
vpcatlas serve --cache ./out/vpcatlas-graph.json
For a quick run in a sandbox, the AWS managed ReadOnlyAccess also works, but it reads far more than the tool needs; do not leave it on a role that stays in place. Credentials work the way the AWS CLI's do: a profile, environment variables, SSO, or an assumed role with an external ID and MFA.
You get the graph, the inventory and a diagrams/ folder. Open any .drawio file in diagrams.net, or import a .lucid file with Lucid Standard Import. Start with vpcatlas-global.drawio. The dashboard opens on http://127.0.0.1:8080 over the scan you just made, without calling AWS again.
There is a binary installer with no Python needed (curl -fsSL https://vpcatlas.com/install.sh | sh, or a PowerShell one-liner on Windows) and a Docker image, which serves the dashboard by default:
docker run --rm -p 127.0.0.1:8080:8080 -v "$HOME/.aws:/home/atlas/.aws:ro" \
  vpcatlas/vpcatlas serve --host 0.0.0.0 --profile audit
The dashboard shows your network topology, so keep it on a private network, or set VPCATLAS_AUTH_PASSWORD and serve it over HTTPS.
What it does not do yet
This is an alpha, and the limits are in the documentation.
- One account per run. Repeat
--profileor--role-arnto merge several into one graph. There is no discovery of the accounts of an AWS Organization yet; you list them. - A snapshot. The files describe the network at the moment of the scan.
- No traffic analysis. No flow logs, reachability analysis or route simulation.
- No contents. No S3 objects, secrets or log events, and no rule or policy bodies.
- Services without a collector. Global Accelerator, VPC Lattice, IPAM, Network Manager and Cloud WAN, Client VPN and a few more.
- AWS only, and a regenerated file replaces your edits, so keep edited copies under another name.
Planned for v2: Network Manager and Cloud WAN topologies, Direct Connect and VPN path tracing, drift between two snapshots, diagram diffs in pull requests, and multi-account runs from an AWS Organizations list.
How it is built and released
I wanted to be able to ask of this tool what I ask of any other: where did the binary come from?
Every change runs lint (ruff, actionlint, zizmor), a type check, the tests on Linux, macOS and Windows with a coverage gate, both Docker images with smoke tests and a Trivy scan, and the installers on three systems. CodeQL, OpenSSF Scorecard and Dependabot run weekly, pip-audit nightly.
A release produces binaries for five platforms, SHA256SUMS, an SBOM, and signed and attested images, and a last job installs the published release with the live installers. The package is on PyPI and the image on Docker Hub, for linux/amd64 and linux/arm64. To check a download:
gh attestation verify vpcatlas-X.Y.Z-linux-x86_64.tar.gz --owner karina-pp
Image signatures and SBOMs start with 0.4.1, and verifying an image signature needs cosign 3 or newer.
Built with AI, runs without it
AI helped me write this tool, and I would rather say so than pretend otherwise. The tool itself needs none of it: no model, no API key, no account with anyone, no bill per token, and nothing leaves your network except the AWS API calls you authorised. Plenty of teams work in places where AI tools are not allowed, or where nobody will pay for them. The diagram should not depend on that.
Where to get it
- Source and releases: https://github.com/karina-pp/vpcatlas
- Site: https://vpcatlas.com
- Documentation: https://vpcatlas.com/docs/
- Docker Hub: https://hub.docker.com/r/vpcatlas/vpcatlas
It is MIT licensed. The most useful thing you can do is run it on a sandbox account and tell me where the drawing is wrong or the reading is incomplete.